


0 0
0 0 operates in the field of 0. 0
0 0
Last update: 0
Quick overview:
-
- Yield: 0
(See here Top 10 highest yield)
-
- Lot: 0
- Price/Earnings ratio : 0 (Ideal <20 )
- Earnings per share : 0 (Ideal >0.001)
- Price as per 0 : HK$0
- Ex-Dividend Date coming up: 0
See here all upcoming Ex-Dividend dates
2024 Interim results: 0
Sector: 0
0
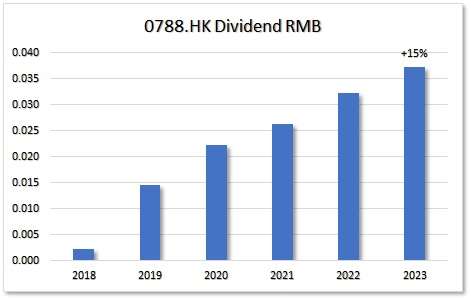
Dividend GROWTH related metrics
-
- Average dividend growth 1 year : 0
- Average dividend growth 3 years : 0
- Average dividend growth 5 years : 0 (Ideal >5%)
- 10% on costs in how many years: 0. How long does it take to get to 10% Dividend yield on Costs? Yield x 5-yr Average dividend growth
- Chowder rule (Yield + 5 yrs average dividend growth) : 0. Ideal would be >15
- Yield 5 yr average: 0
Let’s talk money:
Total Dividends last year: 0 per share
Expected Dividends: 0 per share. Per lot: 0. Dividends last year x 5-yr average Dividend growth.
Dividends come in: 0 Mostly it will be in HKD, yet some are expressed in RMB/USD/CAD
Miscellaneous data on Dividends of the company:
- Dividend since : 0
- Dividend growth since : 0
- No of years Dividend Growth:
- That makes this company a 0
- Payouts/year: 0
- Payout in the following months : 0.
- Ex-date : 0
- Latest dividend announcement: 0
The Data on Risk of not getting a Dividend cut or worse, not getting any Dividends at all:
- Earnings per share : 0 (Ideal >0.001)
- Dividend payout : 0 (Ideal <50%)
- Dividend Coverage ratio: 0 Ideal >2
- EPS 5 year growth rate : 0 Ideal anything >0
- Return on Equity: 0 Ideal >10
- Years of Dividend Growth: . Aim above 7 years. Also check the Dividend Sheet below.
0
Let’s take a look at the liability ratios:
- Debt/Equity: higher than 1.5 might be tricky
- Cash/Short term debt: 0 Ideal >1
- Total Liabilities/Assets: 0 Look for <1
- Net Debt/Equity: 0 Aim for <1
For banks, insurance companies and other financial institutions these benchmarks on liability ratios will not apply.
Data related to Value
0
- Price as per 0 : HK$
- Price/earnings ratio : (Ideal <20 )
- 52 Week low : 0
- 52 week high : 0
- Price to 52 Week Low: 0
- Price to 52 week high: 0
- Graham Number: 0 Ideal if this number is higher than current price
- Price/Book: 0 <3 would be the sweet spot
0
Dividend Report (incl Special Dividends, if any), the history, projection on dividend growth and how many year to get 10% Yield-on-Cost
0
| Dividend Stock Screener 1-100, 1 = very bad, 100 = extremely good. |
||
| GROWTH | 0 | |
| RISK | 0 | 0 |
| VALUE | 0 | 0 |
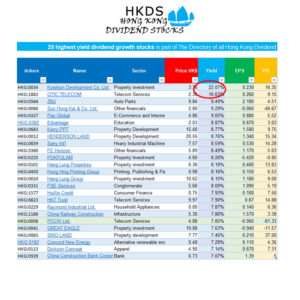
Sign up now and get immediate access to
25 highest yield dividend growth stocks.xls
The Best Part?
It’s completely free. No catch—just honest, data-driven insights that arm you with a consistent approach to dividend growth investing.