191015 Dogs of the Hang Seng
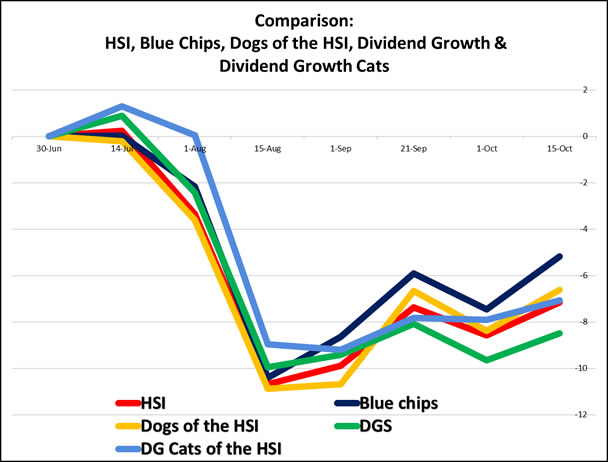
Twice a month we look at how the Dividend Growth Stocks (DGS) are doing compared to the Hang Seng Index (HSI), compared to the Hong Kong Blue Chips and the Dogs of the Hang Seng.
The latter, like the Dogs of the Dow, are the 10 stocks of the Blue Chips, that yield the highest at the given date (June 30, 2019 in this case)
Of all the Dividend Growth Stocks (DGS), we took the 10 with the highest yield at the given date (June 30, 2019) and named them Dividend Growth Cats.
So yes, you are comparing cats and dogs here.
Meet the Cats of the Hang Seng: (Light Blue line)
| Ticker | Company | 30-Jun | 15-Oct | number of stocks | Initial Investment | Current value | |||
| Dividend | Yield | Price | Price | ||||||
| HKG:6033 | Telecom Digi | HK$0.240 | 8.33% | 2.88 | 2.89 | 3472.22222 | 10000 | 10,034.72 | 0.35% |
| HKG:3315 | Gold Pac Group | HK$0.140 | 7.33% | 1.91 | 1.88 | 5235.60209 | 10000 | 9,842.93 | -1.57% |
| HKG:1127 | LION ROCK GROUP | HK$0.100 | 7.30% | 1.37 | 1.23 | 7299.27007 | 10000 | 8,978.10 | -10.22% |
| HKG:3828 | MING FAI INT | HK$0.070 | 7.14% | 0.98 | 0.82 | 10204.0816 | 10000 | 8,367.35 | -16.33% |
| HKG:0086 | Sun Hung Kai & Co. Ltd. | HK$0.260 | 7.12% | 3.65 | 3.38 | 2739.72603 | 10000 | 9,260.27 | -7.40% |
| HKG:1050 | KARRIE INT’L | HK$0.080 | 7.08% | 1.13 | 1.04 | 8849.55752 | 10000 | 9,203.54 | -7.96% |
| HKG:0551 | YUE YUEN IND | HK$1.500 | 7.01% | 21.4 | 21.45 | 467.28972 | 10000 | 10,023.36 | 0.23% |
| HKG:0034 | Kowloon Development Co. Ltd. | HK$0.720 | 7.00% | 10.28 | 9.3 | 972.762646 | 10000 | 9,046.69 | -9.53% |
| HKG:0008 | PCCW Ltd. | HK$0.312 | 6.92% | 4.51 | 4.47 | 2217.2949 | 10000 | 9,911.31 | -0.89% |
| HKG:1333 | CHINA ZHONGWANG | HK$0.270 | 6.85% | 3.94 | 3.25 | 2538.07107 | 10000 | 8,248.73 | -17.51% |
Say hello to the Dogs of the Hang Seng (Yellow line)
| Ticker | Company | 30-Jun | 15-Oct | number of stocks | Initial Investment | Current value | |||
| Dividend | Yield | Price | Price | ||||||
| HKG:0386 | SINOPEC CORP | 0.4916 | 9.26% | 5.31 | 4.66 | 1883.239 | 10000 | 8,775.89 | -12.24% |
| HKG:3988 | BANK OF CHINA | 0.2168 | 6.57% | 3.3 | 3.15 | 3030.303 | 10000 | 9,545.45 | -4.55% |
| HKG:1088 | CHINA SHENHUA | 1.0369 | 6.34% | 16.36 | 16.02 | 611.2469 | 10000 | 9,792.18 | -2.08% |
| HKG:0005 | HSBC HOLDINGS | 3.9983 | 6.17% | 64.8 | 59.95 | 154.321 | 10000 | 9,251.54 | -7.48% |
| HKG:3328 | BANKCOMM | 0.3535 | 5.96% | 5.93 | 5.26 | 1686.341 | 10000 | 8,870.15 | -11.30% |
| HKG:0939 | CCB | 0.3606 | 5.36% | 6.73 | 6.26 | 1485.884 | 10000 | 9,301.63 | -6.98% |
| HKG:1928 | SANDS CHINA LTD | 1.99 | 5.33% | 37.35 | 36.55 | 267.7376 | 10000 | 9,785.81 | -2.14% |
| HKG:0883 | CNOOC | 0.7 | 5.24% | 13.36 | 11.82 | 748.503 | 10000 | 8,847.31 | -11.53% |
| HKG:1398 | ICBC | 0.2953 | 5.18% | 5.7 | 5.44 | 1754.386 | 10000 | 9,543.86 | -4.56% |
| HKG:0006 | POWER ASSETS | 2.8 | 4.98% | 56.2 | 54.4 | 177.9359 | 10000 | 9,679.72 | -3.20% |
Conclusions,
Dogs and Cats are up and chasing each other:
- -6.61% for the Dogs of the Hang Seng.
- -7.08% for the Cats of the Hang Seng.
- -7.15% for the HSI
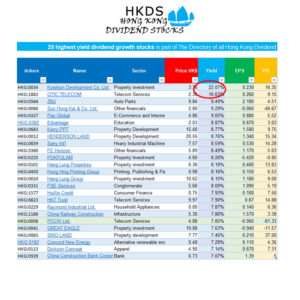
Sign up now and get immediate access to
25 highest yield dividend growth stocks.xls
The Best Part?
It’s completely free. No catch—just honest, data-driven insights that arm you with a consistent approach to dividend growth investing.
