Evergrande Crisis, should you run away from Hong Kong stock market?

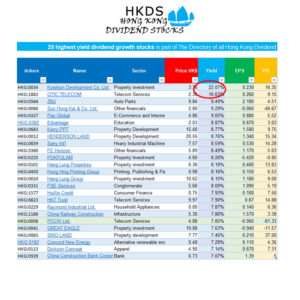
This is the newsletter you get if you sign up (FREE) below to see the stock screeners favorite this week. You also get to immediately download the 25 highest yield Dividend Growth Stocks.
If you need a deeper level and full spectrum of all Dividend Growth Stocks and Blue Chip Stocks of Hong Kong including the stock screener to optimize your (or your clients portfolio), it is recommend to become a Champion member.
The Evergrande Crisis keeping investors and speculators up this week. Questions are asked like “How could this happen?” to “who’s next to come crumbling down?”
The how question is answered in ways better than I can do here by Bloomberg. For answers in the Who’s Next question we can look at other companies in the Property sector that are relatable to Evergrande and their crisis.
(Of course banks can also fail and fall. It could be 2008 all over again, just this time starting in China. But I leave that for now. I am the worst predictor of the future, so I just stick to data. That said, the following is no financial advise. This is a report of numbers and how they reflect in other companies that work in the same sector as Evergrande.)
Aim is to look what the situation in the Evergrande crisis means for the stock price of ‘our’ companies.
- How the 3 Red lines apply to common investment rules.
- And most interestingly, of all Hong Kong listed companies in the Property sector that HKDS follows, who seem to be already aligned with these 3 Red lines?
First, short and simple: What got Evergrande crisis started? Besides a lot of unfortunate events, the most obvious one: there is a problem in their liabilities and how to cover the expenses that come from that.
This is why looking at Dept/Equity Ratio is a helpful first step to evaluate Risk. Too much dept is risky.
You can borrow money as long as you have the means/income to return the costs of borrowing money. If you can not, you need to borrow more to keep things running. Vicious cycle starts.
Back to evaluating Debt to Equity. A healthy number would be anything below 1.5 according to Mr Buffett.
For the property sector we see higher ratio’s. That makes sense because the dept finances (the building of new) assets.
Investopia says a ratio of 3.5 is normal.
And this is where it gets interesting. China announced in August 2020 their 3 Red Lines for the property sector.
What are China’s 3 Red Lines?
- a maximum debt-to-asset ratio of 70%, This means if the company has a total-debt-to-total-assets ratio of 0.7 70% of its assets are financed by creditors, and 30% are financed by owners (shareholders) equity. As a general rule anything below 0.6 or 60% is considered okay [Evergrande 84%]
- 100% cap on net debt to equity ratio (Short term + long term liabilities – cash at hand)/equity) This is also called Net Gearing. “As a general rule, net gearing of 50% + merits further investigation, particularly if it is mostly short-term debt.” [Evergrande 505%]
- cash at least equal to short-term borrowing, minimum 100%. This means short term liabilities should be covered 100% by cash at hand. Also called Cash Ratio In general anything from up 0.5 to 1 is considered okay. [Evergrande: 53.8%]
So clear, this is trouble.
Now what does this mean for the companies that we follow at HKDS?
Just, so we are all on the same page here, we follow HK listed companies that:
- not decreased their dividends consecutively for 5 years or more (Dividend Challengers, Contenders and Champions)
- have an average 5 year dividend growth 5 of at least 0.001
It fits the Dividend Growth strategy of buy-hold-collect increasing dividends.
Evergrande HKG:3333 was not tagged as fitting for this strategy.
Now we do want to know how this side effects the stocks that we follow.
Evergrande operates mainly in the property sector.
There are 37 listings that fall into the property category AND Dividend Growth. Are they at risk?
Average price-fall since Friday September 17 of these 37 stocks is -1.38% ( price of the stock Sep 17 closing – price of the stock Sep 24 closing)
Being the biggest loser : -17% HKG:0683 Kerry Properties
and the winner: +12% HKG:1813 KWG Group
Risk meaning, do they cross red lines? Or worse, is there a chance/risk that the liabilities weigh too heavy and can cause any of them to tumble? Solid question anybody in any market should investigate. A inquiry into the data will provide answers to this question.
Which of the Hong Kong Dividend growth Stocks in the Property sector seem compliant to these 3 Red Lines?
Let’s look at which enterprises seem to have a healthy in the debt and the risk of high debt department;
Here we go: 37 companies, first hurdle is D/E. Debt-to-Equity
Average D/E of all Dividend Growth companies that are in that property sector is 2.78. Remember Investopia mentioning 3.5? And China’s Red lines? Just to be sure lets bring the threshold down to a D/E of 1.5 or less.
Luckily out of our 37 companies there are 21 compliant.
Second stop. Red line number 1: a maximum debt-to-asset ratio of 70%
That leaves us with 15 companies still on board.
No that lets bring in red line no 2: 100% cap on net debt to equity ratio
No Change, still 15 happy enterprises
Final red line: cash at least equal to short-term borrowing, minimum 100%
That knocked 1 out. Out of 37, 14 still in the game. These seems to have their ship in order on the debt part. This is no sure guarantee they are solid investments. This is what the data brings to the show when we compare the figures of Evergrande HKG:3333 to the companies listed in our Directory.
| Tickers | Name |
| HKG:0014 | Hysan Development Co. Ltd. |
| HKG:0016 | Sun Hung Kai Properties Ltd. |
| HKG:0017 | New World Development Co. Ltd. |
| HKG:0041 | GREAT EAGLE |
| HKG:0083 | SINO LAND |
| HKG:0160 | Hon Kwok Land Investment |
| HKG:0173 | K. WAH INT’L |
| HKG:0212 | NanYang Holding |
| HKG:0225 | POKFULAM |
| HKG:0247 | TST PROPERTIES |
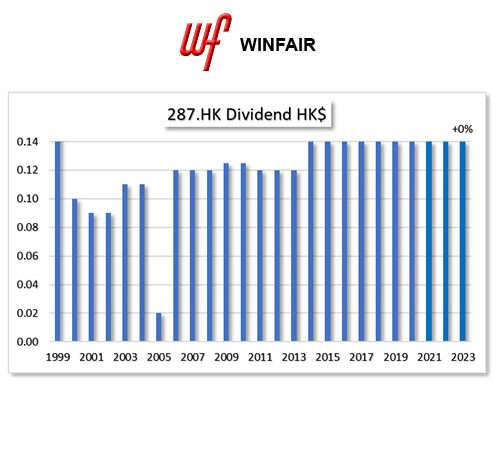
| HKG:0287 | WINFAIR INV |
| HKG:0369 | WING TAI PPT |
| HKG:0683 | Kerry PPT |
| HKG:1972 | Swire Properties |
Not that the other 23 companies are in trouble, it is just that these 14 are completely in the green when it comes down to healthy balance sheet as given by the 3 Red Lines. It also does not state these 14 companies are excellent investments. It is just 1 facet of facet to look at stock and research. Liabilities are Risk, it is the second part of what we look at in the Stock Screener. The other 2 are (dividend) Growth and Value.
For Champion Members who want the compete report incl Price-Value comparison is your first file in the Members area.
In there you will see that, ironically, the companies that took a nose dive this week are compliant to the 3 Red Lines and seem to have their liability management up to par. How do you figure that?
To come to a conclusion: should you run away from the HK stock market in lights of this Evergrande crisis, it would leave opportunities on the table. Make your due diligence, or have somebody do that for you.
Sign up now and get immediate access to
25 highest yield dividend growth stocks.xls
The Best Part?
It’s completely free. No catch—just honest, data-driven insights that arm you with a consistent approach to dividend growth investing.

